Elenz
Using Elenz
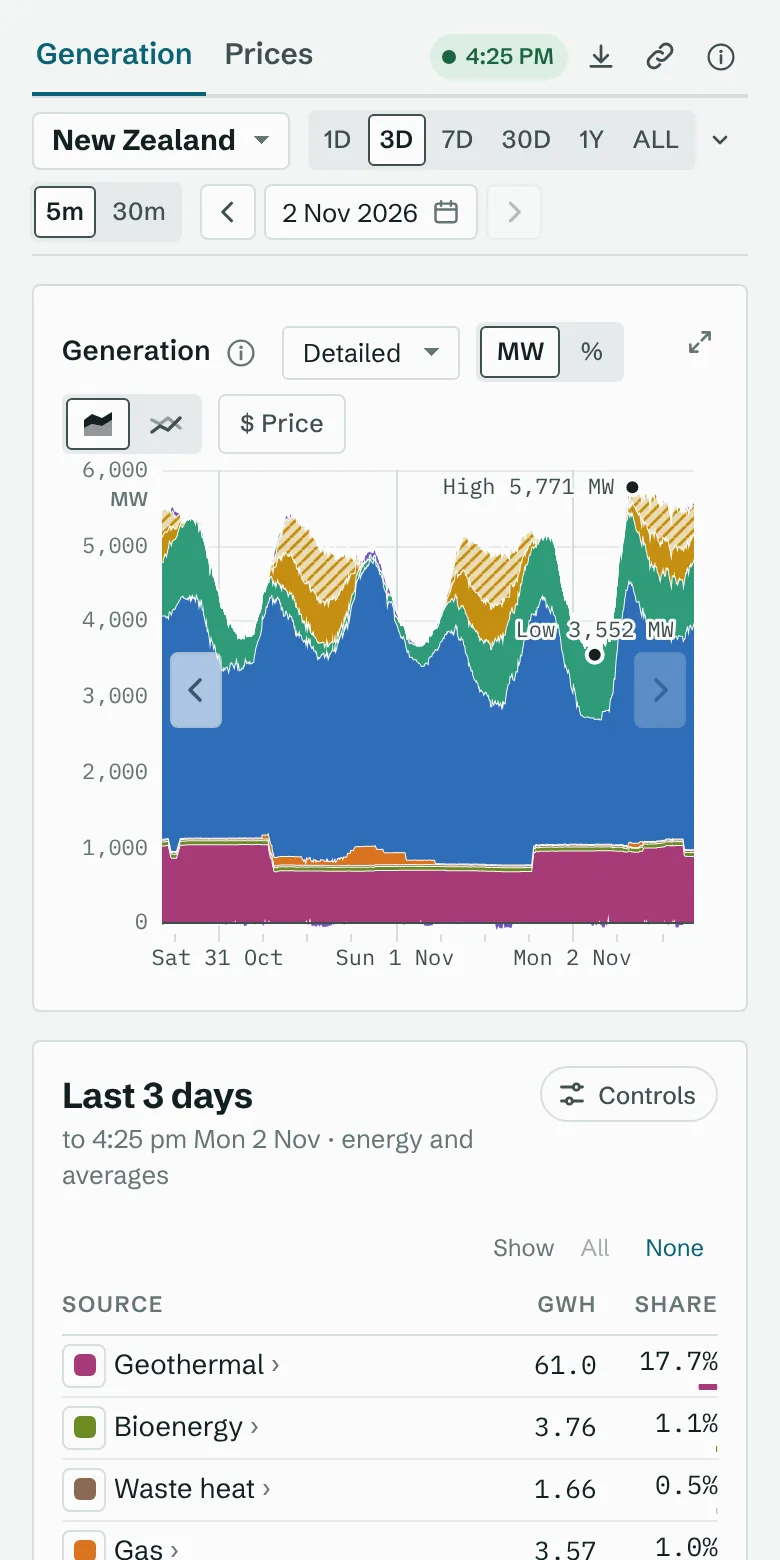
Everything you can do on the site, page by page. The ⓘ beside any chart or card says what it shows; this page covers how to move around.
Tracker: Generation
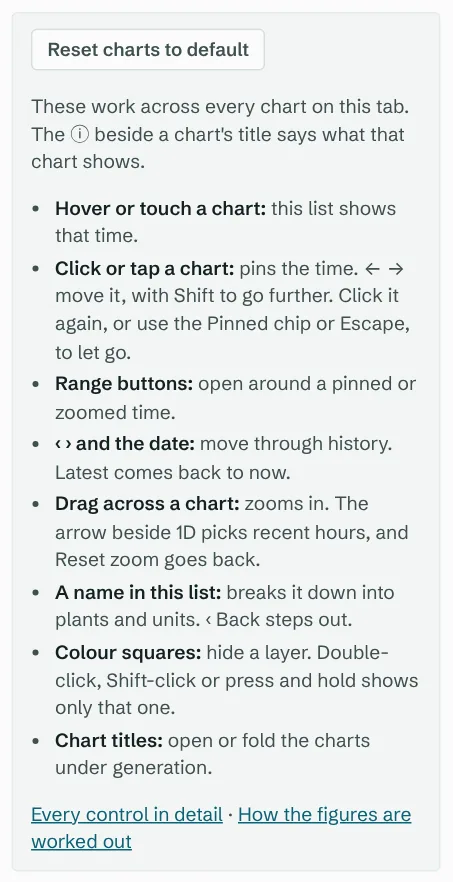
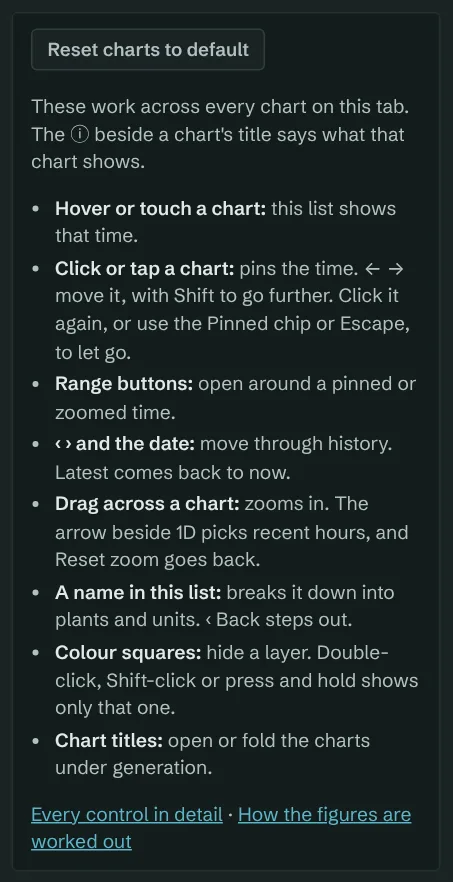
The Controls panel beside the charts has a short version of this.
- Read a time
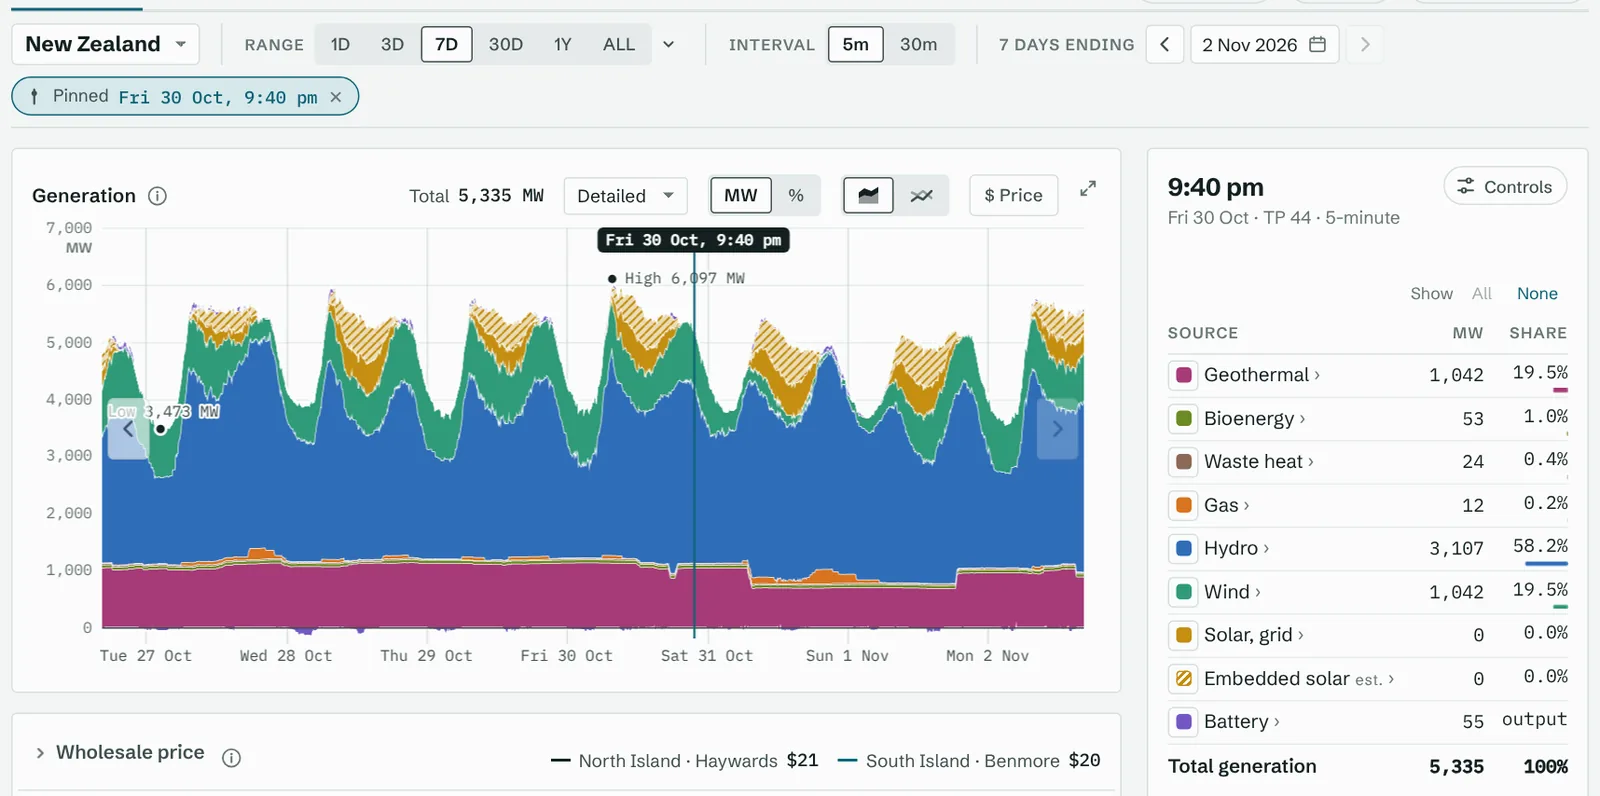
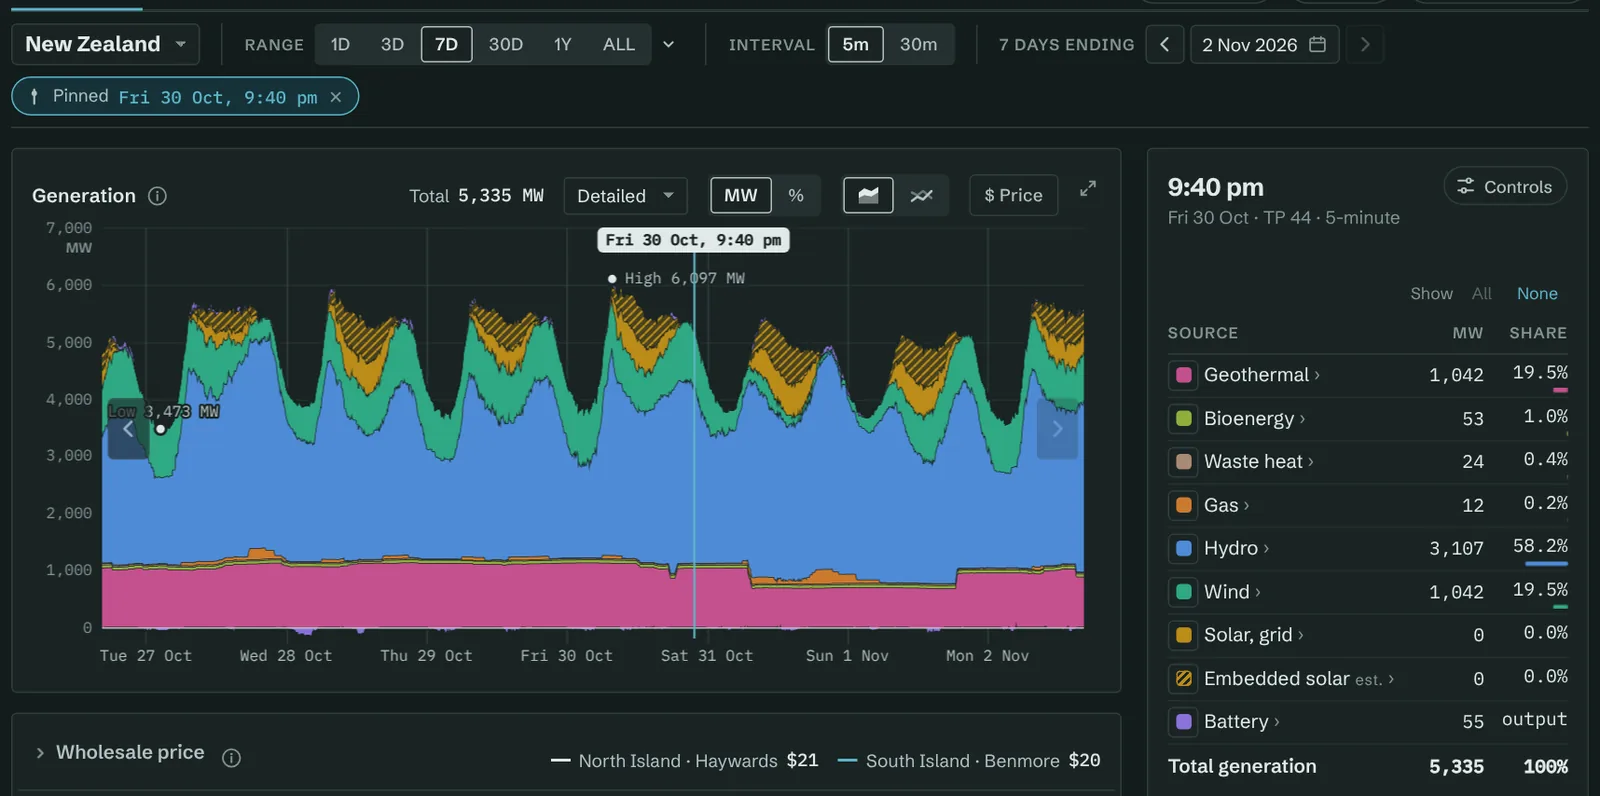
- Hover a chart, or touch and slide on a phone. The list beside the charts shows every source at that time.
- Pin it
- Click a chart to hold the time line there. The bar then shows “Pinned” and the time; select it, click the line again or press Escape to let go. On a phone the line stays where your finger lifts; tap it again to let go. While a line is pinned, ← → move it one point (Shift: further), and Home and End jump to the ends. The pin is the anchor: it stays when you change the grouping, region or chart type, and a range button opens the new range around it, still pinned (a pinned day opened on 1D shows that whole day instead). The ‹ › arrows step away from it, and it lets go once it leaves the chart. Share can mark the pinned time.
- Move through history
- Range, interval and region are in the bar at the top. The ‹ › arrows beside the date, on the generation chart, or Page Up and Page Down step back and forward by the range. The date opens a calendar: select the month name to jump to another year, then pick a day. Latest comes back to now, or moves a zoomed stretch to the newest data.
- Zoom in
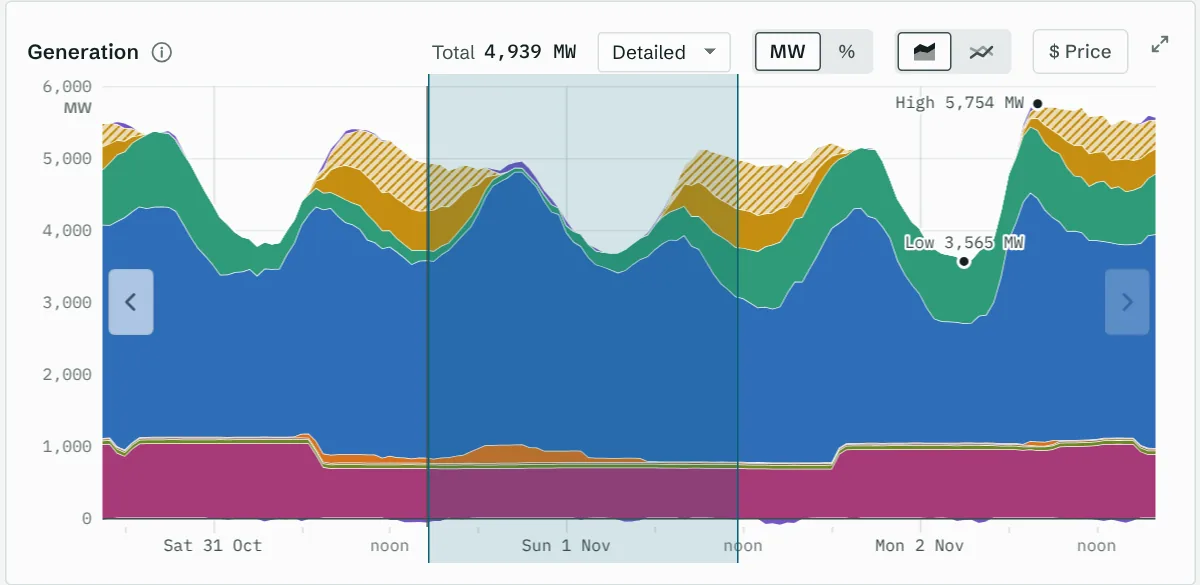
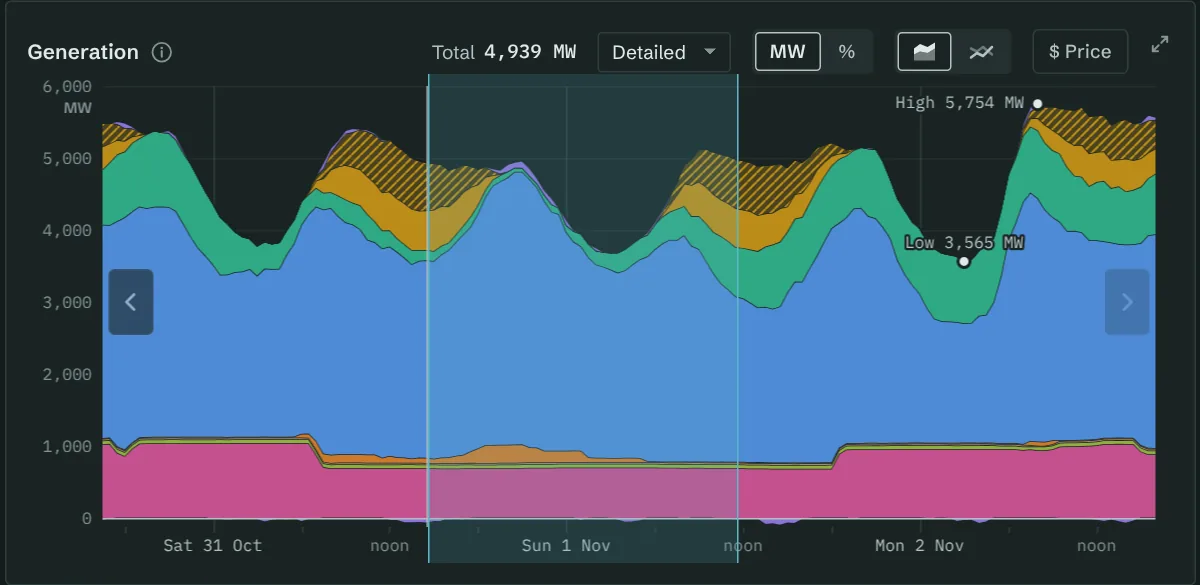
- Drag across any chart to zoom into that stretch; every chart follows. The arrow beside 1D picks the last 1, 3, 6 or 12 hours. While zoomed, the date box gains a time: pick the hour, then the minutes, to move the zoomed stretch so it ends then (NZ time), or the ‹ › arrows step by the zoom’s length. Reset zoom in the bar, or Escape twice, shows the whole range again, and choosing another range while zoomed opens that range around what you zoomed into.
- Break it down
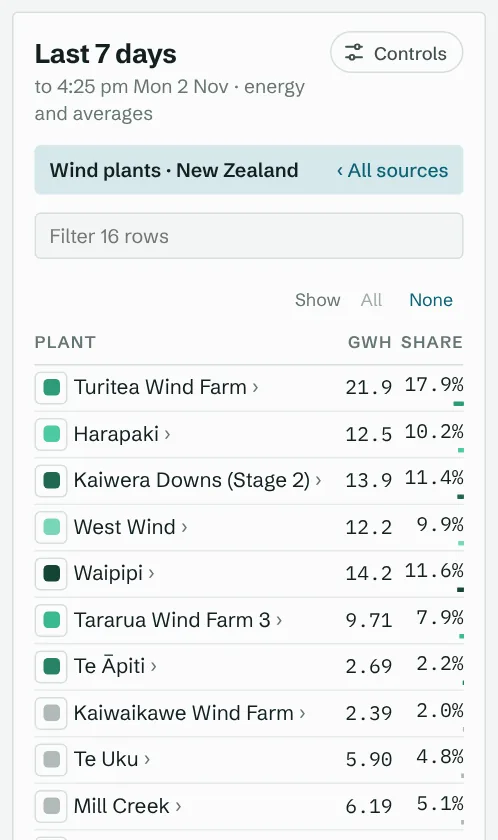
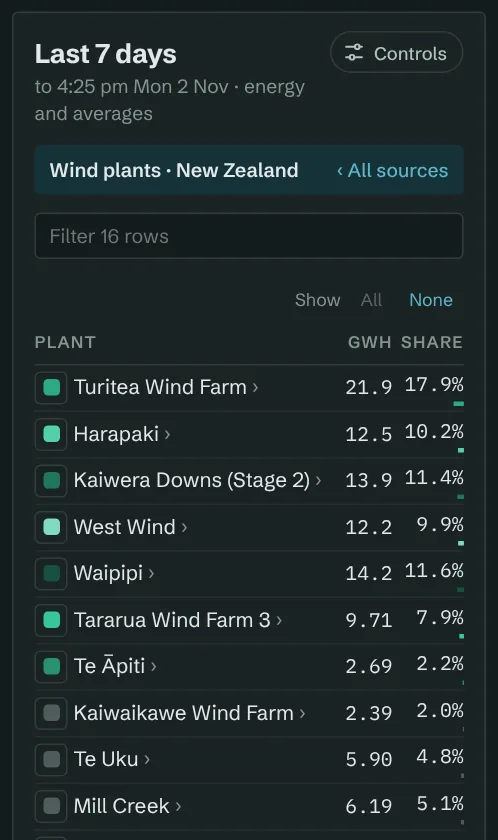
- Select a name in the list to go from a fuel to its plants and their grid connections; ‹ Back above the list, or the browser’s Back, steps out. The menu above the generation chart groups it other ways: by site, hydro scheme, owner, flexibility, renewable vs fossil, inverter vs synchronous. MW/% switches to shares.
- Compare sources
- The two chart buttons beside MW/% switch between stacked areas and lines, one per source, so plants or fuels can be compared on one scale: drill into a fuel or choose By site, then hide what you don’t need. Up to eight lines get their own colours. $ Price draws the island prices over the chart on a right axis (spike-proof: linear to about $100, compressed above).
- Hide and show
- Select a colour square to hide that layer; the address keeps what’s hidden, so a shared link shows the same. Double-click it, Shift+click it or press and hold it to show only that one (again to show everything); All and None above the list do the rest. In long lists, type in Filter (it also finds a plant by its other names, such as Taranaki Combined Cycle for Stratford), and select a fuel heading to fold its plants. A plant's own view lists its other names and, where its metered history counts something different from the dispatch data, says what.
- Open more charts
- The charts under generation (price, renewable share, demand, HVDC, emissions) start folded to one line each, showing their value at the time line or for the whole range. Select a title to open that chart, and again to fold it.
- Enlarge, share, download
- The corner button on each chart enlarges it, and ⓘ beside its title says what it shows and how it’s made. Share copies a link to this view, live or for the dates shown; Download gives the charts as a picture or the data as a spreadsheet file. The address always holds the whole view, so it can be bookmarked.
Tracker: Prices
- Read and pin
- As on Generation: hover or touch to read a time, click to pin it, ← → to move a pinned line.
- Zoom in
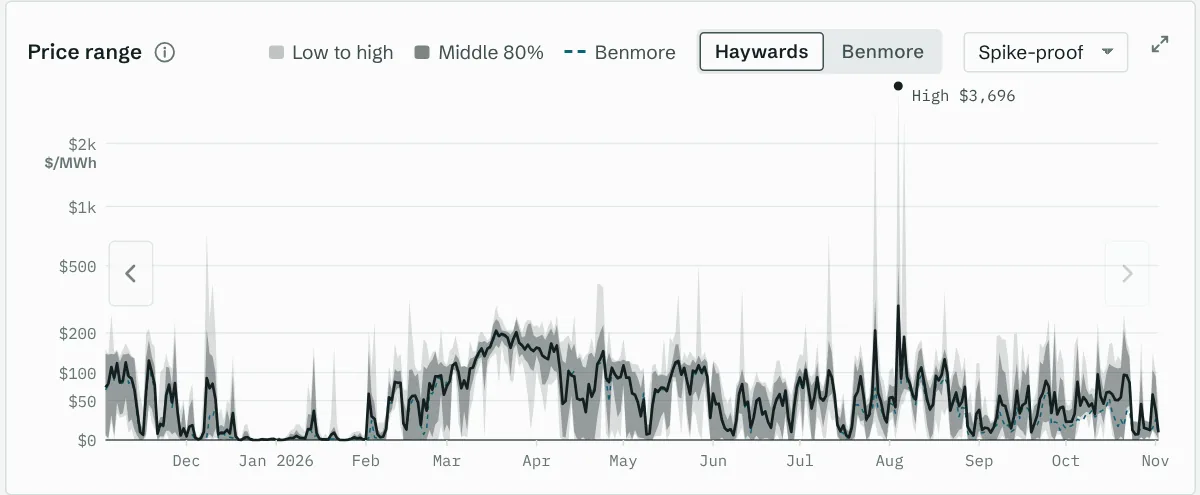
- From 1D to 30D, drag across any chart to zoom into that stretch, or pick the last 1, 3, 6 or 12 hours from the arrow beside 1D. Reset zoom, Escape or a range button goes back. 1Y and ALL show each period’s range of prices rather than every half-hour, so they don’t zoom.
- Nodes and scales
- Select a node’s colour square in the list to hide or show its line. The menu beside the price chart’s title changes its scale (Spike-proof, Capped or Linear); on long ranges, choose the island whose price range is shown.
Back to the default charts
The tracker remembers your last region, range, interval and chart settings in this browser. Reset charts to default, at the top of either tab’s Controls panel, clears them.
Now
- Why is the price high?
- The button in the wholesale price tile opens the price explainer: whether the price is usual for the time of week, and what is different when it isn’t. The button lights up when there’s something to see.
- Every generator right now
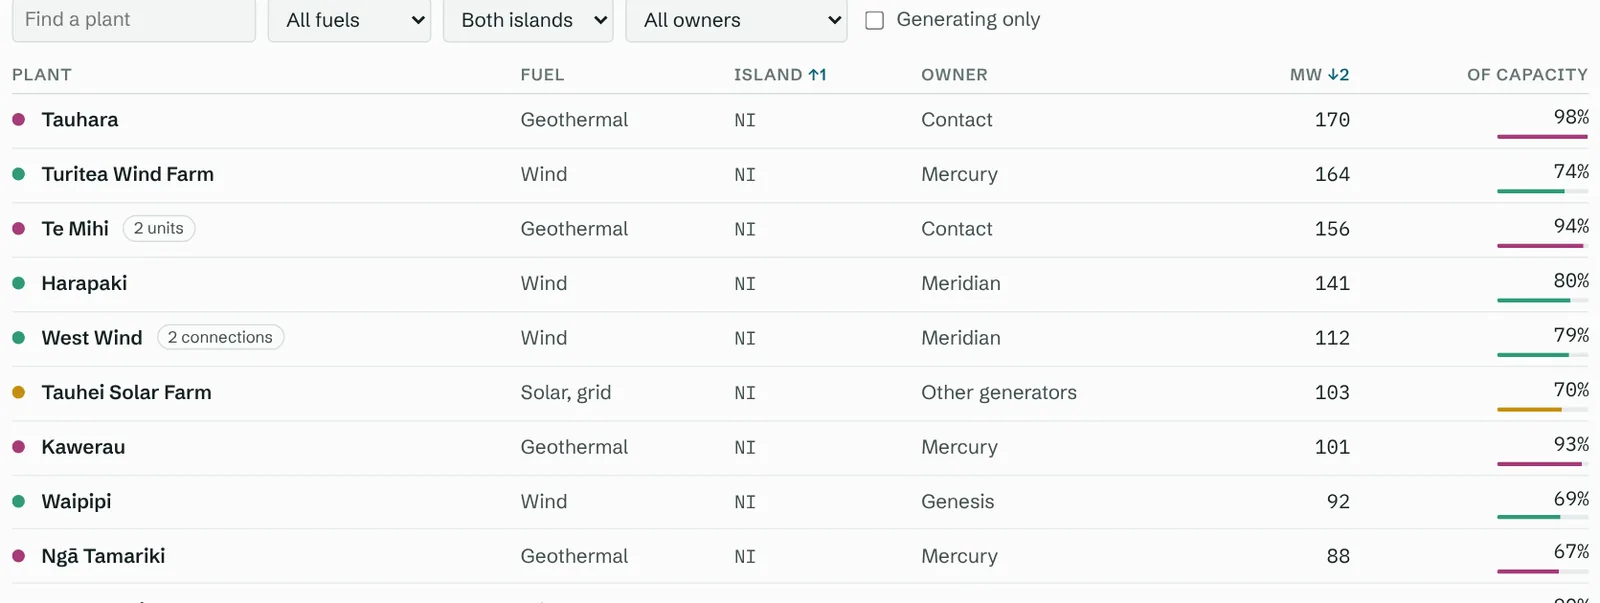
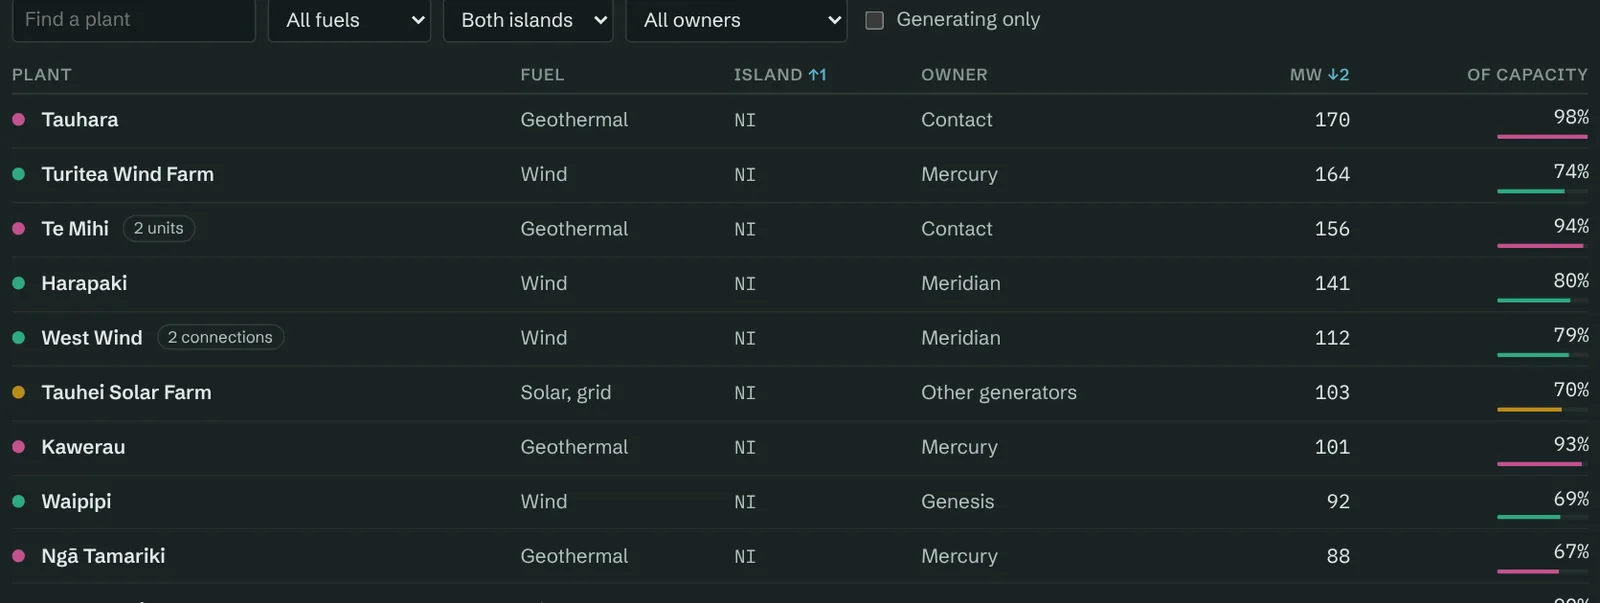
- Select a column heading to sort by it, and again to reverse it. On a computer, Shift-click another heading to sort within it, such as island then MW. On a phone, use the Sort and Then menus. Filter by fuel, island or owner, or type a plant’s name; each plant links to its history on the tracker. The address keeps these settings, so a view can be linked.
- Keep screen on
- Stops your screen going to sleep while the page is open, for leaving it up on a spare display.
Records


- The lists
- Heading for a record and New and provisional sit at the top. Under them, All-time records has the region picker and the period buttons, from a trading period to a year; Milestones and By month show New Zealand and each island side by side, and By month’s TP and Day buttons switch between trading periods and whole days. Point at a row to light up the same record in each region’s card, and click to hold it.
- A record’s page
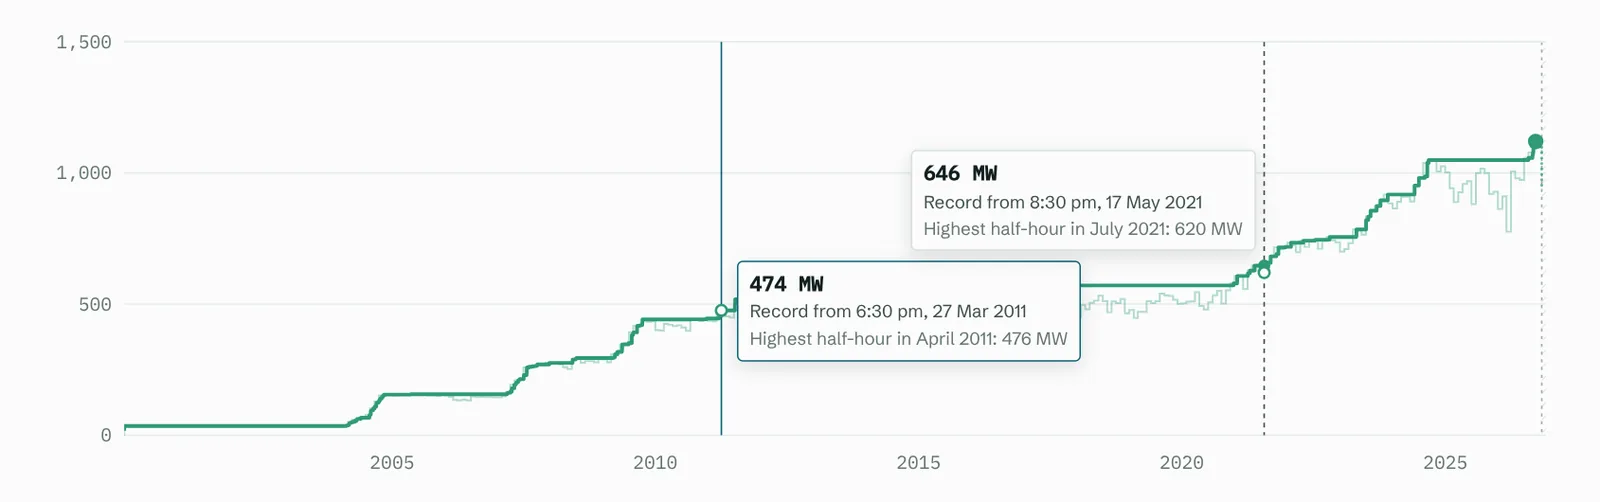
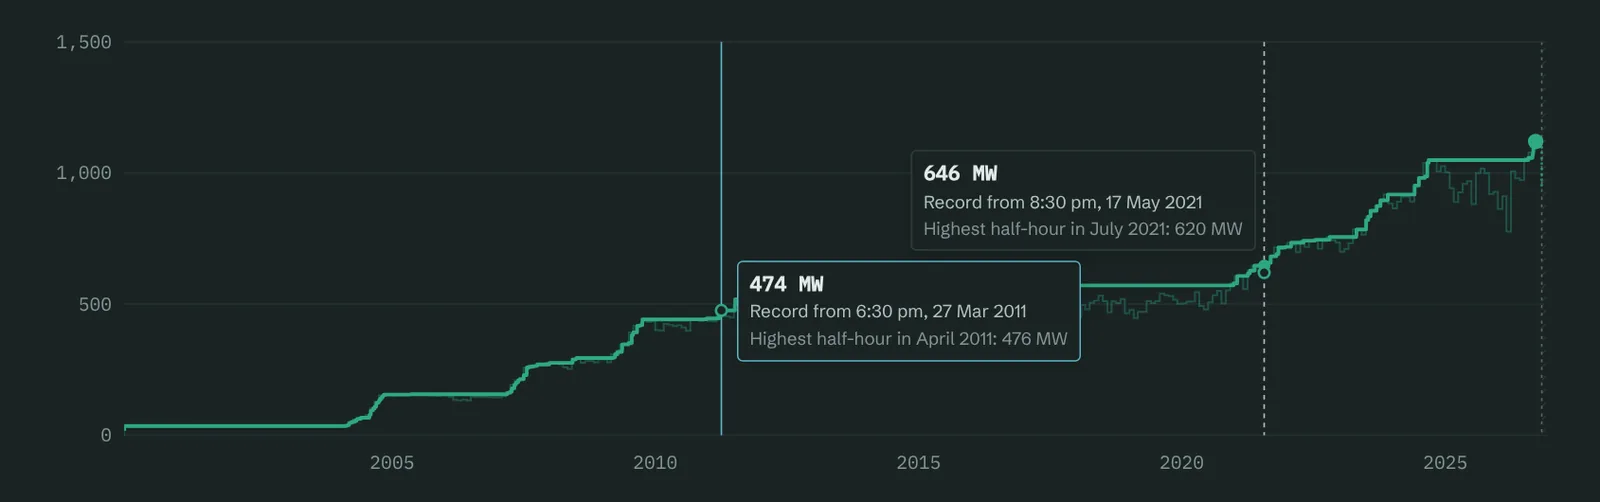
- Hover a chart to read it, and click to pin a point: the pin stays while you hover elsewhere, so two points can be compared. Click it again or press Escape to let go. Drag across a chart to zoom in; Reset zoom goes back.
- Share and Download
- Share sends the record’s link (on a phone, with its image), and Download saves the image in the page’s light or dark colours.
Everywhere
- Light and dark
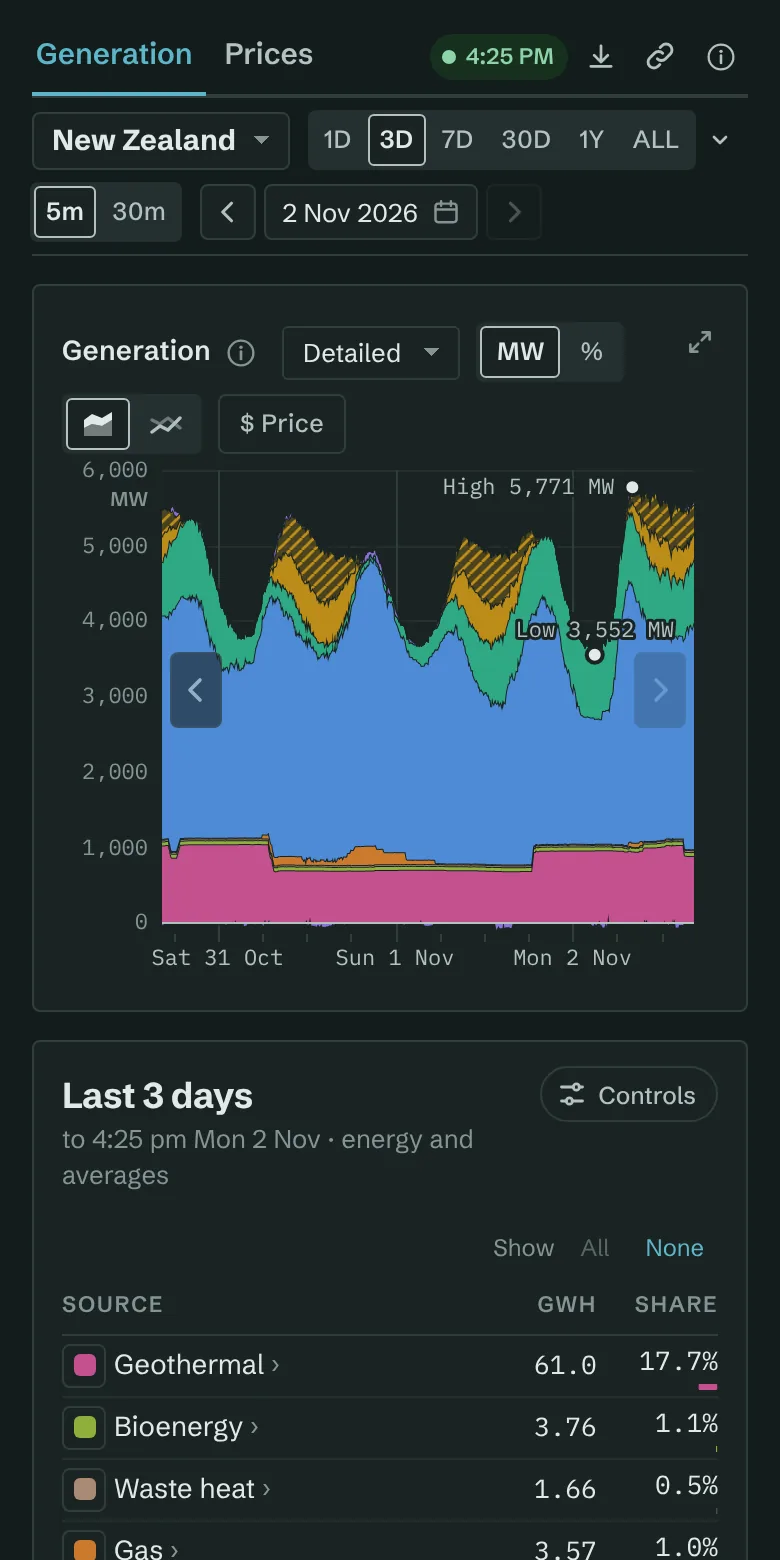
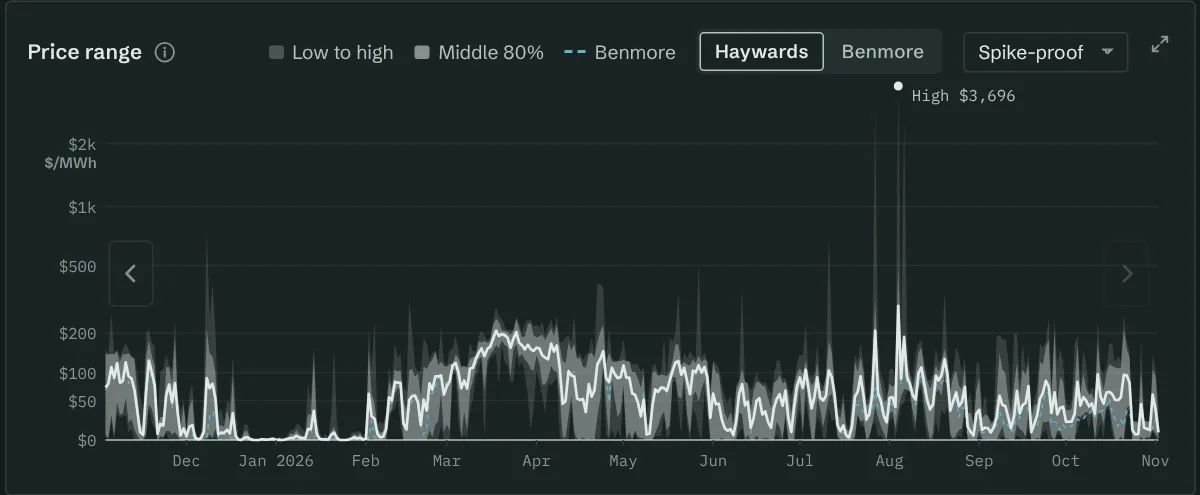
- The button at the top of each page switches between them; the site remembers your choice in this browser.
- Something looks wrong?
- Report a problem, at the foot of every page, starts an email with the page’s address filled in.